Dr. Giacomo Vacca, Kinetic River Corp.
As appeared in BioPhotonics Oct 2014. Download pdf
New multiparametric modeling tools drastically simplify the design of complex biophotonic systems.
For all the sophistication of modern engineering practice, the design of complex biophotonic systems remains as much an art as a science. This means that the skill and insights of individual designers and design teams are critical to the performance of the system.
This is even truer at the system level than at the component level: Given a low dimensional, well defined task, such as minimizing spherical aberration or creating an image at a required distance from the object, widely available engineering tools can take out much of the guesswork. However, when the task is performance optimization of the whole system, with a much higher dimensionality and often more vague metrics of success, existing tools fall short. It is then that the designer’s experience and skill come in to win the day, matching critical design goals to the most cost effective technology, knowing the strengths and limits of different architectures, etc.
Complex microscopes
A case in point is microscopy. A bewildering array of microscopy tools is in active use today, from the tried andtrue brightfield and darkfield setups, to a growing arsenal of instruments offering Raman and two photon techniques, to the radically innovative super resolution approaches of STED (stimulated emission depletion) microscopy and PALM (photoactivated localization microscopy). Many junior engineers could use common beam propagation analysis software to adequately specify a best form lens or a compound objective suitable for use in these machines. But the design of a complex microscope to deliver acceptable performance across the range of intended applications requires an uncommon degree of system level understanding – including, for example, a grasp of tradeoffs in ultrafast laser performance, chromatic implications of different architectures and approaches to global footprint minimization.
Existing tools include componentlevel optical design and optimization offering accurate and increasingly sophisticated modeling performance, but systemlevel optical design and optimization tasks can be challenging for them. The typical user interfaces of opticalpropagation software – and even the kinds of questions that they assume a designer wants to answer – are simply not a good match for the multiparametric “octopus wrestling” kinds of problems faced by systems designers.
Some recent developments are reason for optimism. Semrock’s SearchLight, an online spectral visualization tool, allows the simultaneous comparison of light source spectra, fluorophores, beamsplitters, filters and even user uploaded custom parts; Radiant Zemax’s PartLink offers integration with the computer aided design (CAD) software package SolidWorks. These are examples of modeling environments that go beyond the individual component or subassembly to support a designer’s need to evaluate performance attributes across an entire system.
A flow cytometer design project can help demonstrate two new automation technologies: Kinetic River’s Live Ideas and BeamWise from BeamWise Inc. These two tool sets enable the creation of a virtual lab bench and the rapid exploration of “what if” design scenarios. By modeling not only optical propagation, but also system critical domains – such as the distribution of cells in the flow channel, and the form and fit of necessary optomechanical support structures – they make it possible to identify and fix issues early in the design process, saving valuable time and reducing costly dead ends in prototyping.
Flow cytometry ‘flight simulator’
Live Ideas is a standalone system modeling tool built on National Instruments’ LabView platform. By capturing aspects of system performance in both the optical and the fluidic domains, it allows designers to ask system level questions, such as: How will the coefficient of variation (CV, a critical metric of performance in flow cytometers) respond to drift in laser alignment? It’s dashboard like user interface provides instant feedback to exploration of the design parameter space, and its efficient high level modeling is the basis for realtime refreshing of the system performance graphs. It’s like a flight simulator: Users know right away when a “crash” is imminent, and they can avoid it with design tweaks.
The tool is suited for several stages in the design process: (a) initial exploration of different system architectures; (b) detailed modeling of system response to specify parts for purchase; (c) quick reaction to a supplier’s failure to deliver (by modeling the impact of using a replacement component from another supplier); and (d) generation of system design documentation for the client.
Virtual reality for systems designers
BeamWise is a CAD automation software tool built on top of Design Parametrics’ Design++ platform and AutoDesk’s AutoCAD. It is a beam anchored CAD and design automation tool. It knows where the beam is and what the spatial relationship is between the beam and each functional optical component. Model generation is based on a network description of the system, with optical components acting as nodes and beam segments connecting them as vectors. The beam centered structure makes a 3D system model instantly updatable: A beam segment is shortened, and everything downstream follows suit – maintaining established relationships among the components. It also incorporates 3D modeling of optomechanical support parts necessary to hold the functional components in place.
The tool is most useful in the following situations: when planning the architecture of the flow cytometer to help visualize the overall layout; when checking against the occurrence, and resolution, of any spatial “collisions” between components or their optomechanical supports; and, in conjunction with Live Ideas, when confirming the predicted 3D configuration of the system after design tweaks resulted in component motion or replacement.
Practical example
Let’s walk through a practical example taken from flow cytometry. For simplicity, we’ll stick to the basics: a single light source, a few beam delivery lenses, a sample interrogation flow cell, and three paths for collection and detection of scattered light and fluorescence.
The first step is to sketch a schematic layout of the system (Figure 1). At this point, we are trying to define the overall architecture, not the details of individual components. Then, in Live Ideas, a customized model reflects the architecture sketched out in Figure 1.
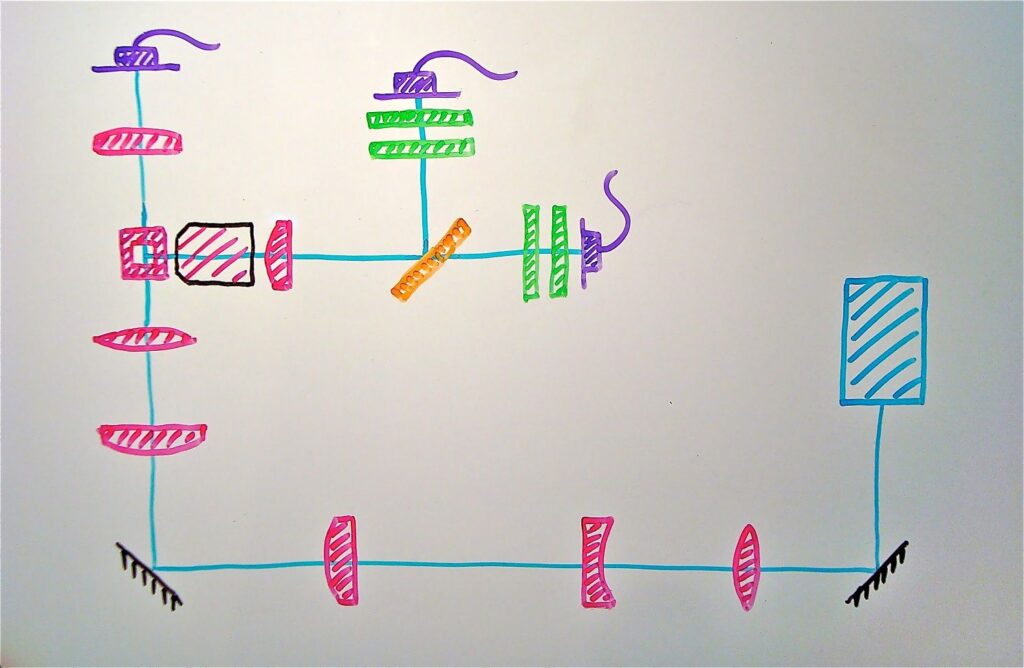
Figure 1. Flow cytometer schematic layout: laser (light blue), mirrors (black), lenses and flow cell (pink), beamsplitter (orange), filters (green), detectors (purple). Images courtesy of Kinetic River Corp.
The dashboard interface (Figure 2) displays all the important design elements needed: input design parameters (sliders on left), manufacturing variability (centertop panel), fluidic parameters (centerright panel), detailed optical performance (graphs in the middle) and “bottom line” metrics (e.g., the CV, yellow panel at right).
Playing with the input parameters and monitoring system performance across the entire instrument allow the designer to quickly explore different design approaches, such as various degrees of beam expansion or even removing a lens from the system. The graphs are updated in real time to give a feel for how the system is likely to behave – and even to inspire alternative layouts not previously considered. Using the CV value, designers can also see what tolerance the system will have against unavoidable variability in either component performance or the manufacturing process.
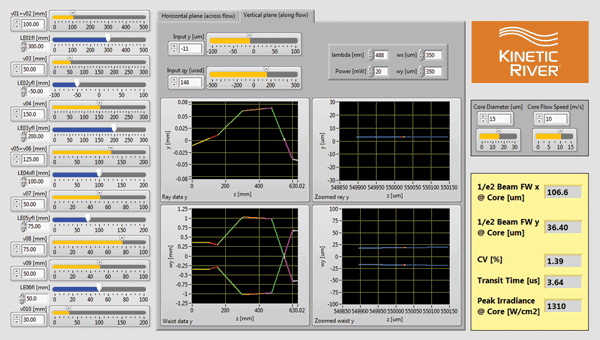
Figure 2. The Live Ideas dashboard used to model and explore system behavior of the flow cytometer layout of Figure 1.
Once the design first cut is reasonably satisfactory, the designer can extract the essential parameters (such as the nature of each optical component and the distance between them along the beam paths) into a spreadsheet (Table 1). This document summarizes, in a form suitable for import into BeamWise, the system layout and the component relationships. Other sheets (not shown) detail the hierarchical relationships between functional and support components (e.g., between a lens and its mount).
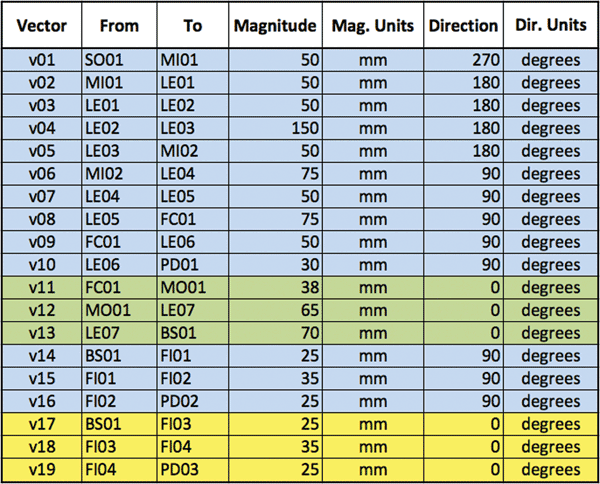
Table 1. Networkbased description of the flow cytometer design from Live Ideas. Each functional beam segment in the system is captured in this list.
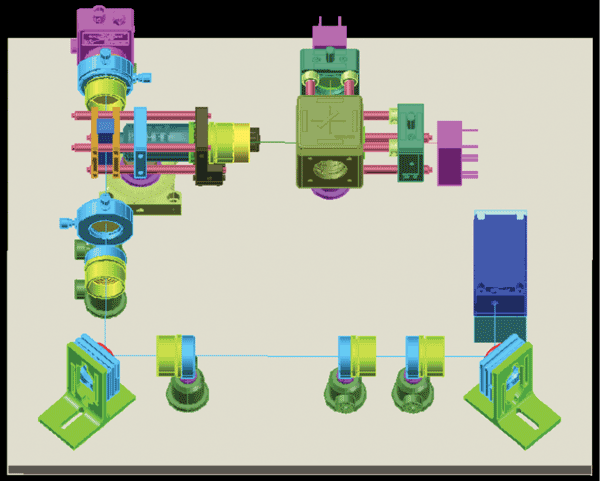
Now the entire system can be visualized in 3D. Based on the input network description (Table 1), BeamWise automatically generates the CAD model using preloaded component information in a database and presents the system as laid out in a 3D view (Figure 3).
Traditional CAD actions such as shading, rotating, panning and zooming can help get a feel for the layout. But the beamanchored architecture lets users “reach in and touch” the system model. For example, they can select a beam segment and change its direction or length, and the tool reflects the change as propagated downstream through the entire system. The user can even replace a component with another one from the database, and the new part will appear, complete with an appropriate default set of supporting hardware, such as a post and a post holder.
Design documentation and other drudgery
For many designers, design documentation is as much fun as a root canal. However, few things are more critical to longterm sustainability of a product (for medical and other applications) than a properly maintained design history file. Export options can lift some of the burden of documentation. For example, designers can generate a fully costed bill of materials automatically, as well as layered 2D dimensioned drawings (Figure 4), to hand out to the manufacturing engineering department.
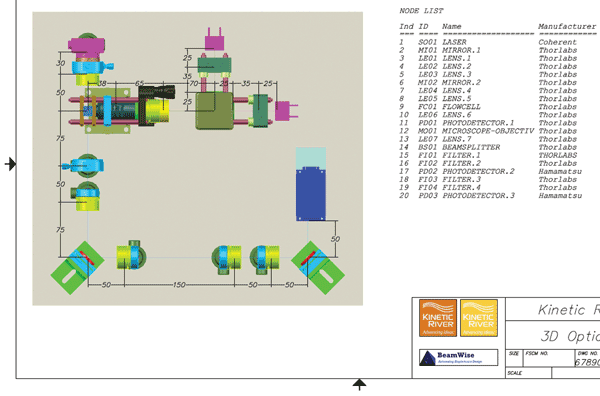
Figure 4. Detail of BeamWise 2D dimensioned drawing and parts list.
Many componentfocused tools developed to accurately model beam propagation do not easily lend
themselves to the kinds of multidomain simulations needed in many biophotonics applications.
They also do not support the kind of systemlevel performance optimization that instrument designers are routinely called upon to deliver. New and emerging tools are starting to fill the gap by making it easier and more intuitive to ask (and answer) systemlevel questions. They can catch potentially serious design oversights, identify more costeffective approaches, improve overall performance and bring solutions to market more quickly.
Better and more sophisticated design tools, and even designautomation solutions, will not replace the insights and expertise of systems designers. They’re not meant to. Used properly, they instead let the designer focus on tasks only he or she can perform – while automating away a lot of the grunt work.
Meet the author
Dr. Giacomo Vacca is the president of Kinetic River Corp. in Cupertino, Calif.; email: gvacca@kineticriver.com.
